
CIO market update for September 2026
In this CIO market update, Rob Hogg reviews September’s key market drivers. For the second consecutive month, the most significant market moves in September occurred in bond markets, driven mainly by a sharp upward move in US yields as investors upwardly repriced the likely future path of US monetary policy tightening.

For the second consecutive month, the most significant market moves in September occurred in bond markets, driven mainly by a sharp upward move in US yields as investors upwardly repriced the likely future path of US monetary policy tightening. This repricing led to a significant “bear-flattening” in the US yield curve (as short term yields rose by more than longer term yields), but in most other markets, including Australia, a parallel upward move in yields was apparent over the month. Key is the fact that “real” yields are driving rates higher, not an increase in inflation expectations.
The sharp upward revision of US policy tightening expectations had most impact on US small cap sentiment (this sector of the market being highly sensitive to changes in expectations about US domestic conditions), with the Russell 2000 index falling 5.5% over the month. The Dow Jones was also weaker – down 4.3%, but the S&P 500 slipped just 0.45% while the Nasdaq actually rose around 2%. The Australian equity market was also weaker over the month with the broader market (ASX 300) and the small cap index (Small Ordinaries) both retreating by around 2.4%.
A lack of progress in finding a settlement in the Middle East led to an increase in the oil price over the month while copper and gold prices both fell.
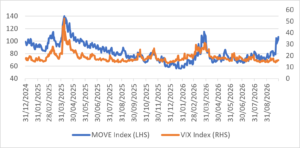
The sharp sell-off (rising yields) in global bond markets led to a very sharp increase in measures of bond market volatility (MOVE Index) with the index nearly breaching the levels in March as the Middle East war broke out. However, equity volatility remained well-contained – it’s rare for higher volatility not to be exhibited by both markets at the same time and may suggest that the forces pushing global yields higher (upward revisions to growth and financing requirements (increased public and private bond issuance)) are not currently regarded as negative for equity earnings prospects.
As US monetary policy expectations moved higher over the month, so too the US dollar (USD) rallied with the broad-based DXY Index rising around 2%. The AUD weakened against the strengthening USD
Macroeconomic data released during the month was generally consistent with ongoing upside surprise in the US. US inflation remains somewhat “sticky”. European data also generally continued to improve. Domestic economic news continues to point to slowing, in sharp contrast to the picture a year ago when the economy was accelerating. Local inflation data at end month pointed to a tentative peak in upward inflation momentum, possibly enough to keep the RBA on hold in coming months following their late month policy tightening. Both the US Fed and the RBA raised rates during the month, but the Fed is seen likely to continue hiking rates while the RBA may have finished
Key market movements over September were as follows:
- S&P/ASX300 Accumulation Index (i.e., including dividends) fell by 2.4%.
- S&P/ASX Small Ordinaries (Australian Small Companies) Accumulation Index retreated by 2.3%.
- US equity market (S&P 500) fell around 0.5%
- Measures of market volatility diverged significantly with bond market volatility (the MOVE index) rising sharply while equity market volatility (the VIX index) was little changed.
- The US bond market ended the month with the yield curve having flattened sharply as yields on longer-dated securities (30-year bonds) rose around 0.40% while shorter-dated yields (2-year notes) ended 0.55% higher.
- The Australian bond market behaved slightly differently to the US, with both shorter-dated (2-year) and longer-dated (10-year) security yields rising by around 0.25%
- Driven largely by the change in Fed policy expectations, the USD rose against most currencies in September, including the AUD which slipped to USD 0.6950 from USD 0.7170
As we have been noting in recent months, the global economy has weathered the ongoing impact of the Middle East war far better than most investors had feared. Initial sharp falls in household and corporate sentiment/confidence surveys have not been followed by similarly weak economic data. In fact, it seems that the significant fiscal stimulus measures being enacted by a number of governments across the globe are contributing to an increase in economic momentum, which is positively surprising investors.
But risks emanating from the war are not over – key remains the risk of a renewed and persistent rise in the oil price which could negatively impact consumer and corporate sentiment, corrode (still) generally well-behaved inflation expectations, and force central banks into even more rate hikes.
Regarding the potential risk from the continued increase in global bond yields, two elements are key – the rate of the increase in yields, and the cause of the increase in yields.
The rate of increase in yields has accelerated recently with a consequent impact on bond market volatility which does raise the risk of a bond market-related “accident”. But, as we have been noting, global yields are rising because “real” yields are rising, not because inflation risk is rising.
It seems that rising real yields are indicating an increased market indigestion due to the rising supply of bonds (due to rising government and corporate bond issuance) but could also indicate an upgrade in investor’s growth expectations, there being a correlation between the pace of real (GDP) growth, earnings growth and real yields. So rising real yields need not be a negative factor for financial markets. And perhaps this is why equity markets have been relatively little impacted by the increase in yields so far.
Regarding the outlook for domestic financial markets, unfortunately the Australian economy is following a different trajectory to most countries, driven by the pre-existence on an upward inflationary impulse which pre-dates the Middle East war and led the RBA to tighten policy on February 3 (before the war began).
We remain of the view that it has been the change in expectations about the policy outlook (from rate cute expectations in September last year to expectations of rate hikes a few months later, and then actual hikes in early 2026) that has retarded the performance of the Australian share market (particularly for domestically focussed companies), and caused local bond yields to rise.
As we’ve been noting for several months now, it will likely only be at the point in the future when the local bond market begins to “look-through” any further potential rate hikes and instead begins to focus on potential medium-term rate cuts that this current negative sentiment could lift. Following the RBA’s latest rate hike, and a slight easing in inflation momentum, this point may be getting closer
Another element in the domestic outlook is the impact of the now clear weakening in the Australian economy across household spending, business sentiment and the housing market, but any accelerated weakening could of course bring forward the potential for an RBA rate cut (or a least mitigate the need for further RBA rate hikes.
In this monthly update we look at:
- Bond volatility has increased sharply in September, but equities seem little impacted
- Rising yields still being driven escalating “real” yields, not inflation fears
- Following a spike in 10 year yields similar to what occurred last month, what do equity markets do?
- Volatility in the key non-farm payroll release makes discerning a trend in the US economy difficult, but the trend seems to be up
- Surveys of the manufacturing and services sectors also suggest that the US economy is strengthening
- As near unanimously expected, the RBA raised rates again in September. They may be finished
- August inflation report suggests that monthly momentum in inflation pressure may have peaked
- Australian business confidence falls in August
- Australian consumption spending is also slowing
- The outlook
Bond volatility has increased sharply in September, but equities seem little impacted
In an extremely rare occurrence, volatility in bond and equity markets have diverged sharply in the past month. The sharp sell-off (rising yields) in global bond markets has led to a very sharp increase in measures of bond market volatility (MOVE Index) with the index nearly breaching the levels in March as the Middle East war broke out.
However, equity market volatility remains well-contained – it’s rare for higher volatility not to be exhibited by both markets at the same time. This divergence may suggest that the forces pushing global yields higher (upward revisions to growth and financing requirements (increased public and private bond issuance)) are not currently regarded as negative for equity earnings prospects.
Divergence in the MOVE and VIX indexes
Source: Bloomberg
Rising yields still being driven escalating “real” yields, not inflation fears
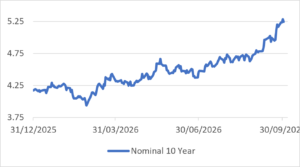
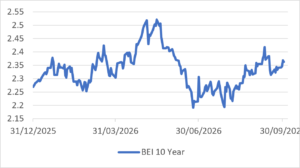
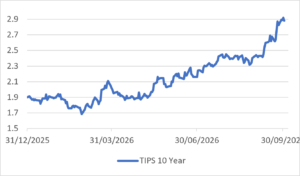
The continued increase in (nominal) bond yields in September was driven by an ongoing rise in the “real” yield component of the overall bond yield. This has been the pattern all year, across nearly all global bond markets, including Australia
For reference, total nominal yield = real yield plus inflation compensation (the breakeven rate)
For US 10 year bonds, this equation is:
- 287% (nominal yield) = 2.918% (real yield) plus 2.369% (inflation break-even)
US 10 year nominal yield (%) 2026 YTD
Source: Bloomberg
US 10 year “Break-even” inflation (%) 2026 YTD
Source: Bloomberg
US 10 year “Real” (Treasury Inflation Protected) yield (%) 2026 YTD
Source: Bloomberg
As we noted earlier, it seems that rising real yields are indicating an increased market indigestion due to the rising supply of bonds (due to rising government and corporate bond issuance). But this could also indicate an upgrade in investor’s growth expectations, there being a correlation between the pace of real (GDP) growth, earnings growth and real yields. And perhaps this is why equity markets have been relatively little impacted by the increase in yields so far.
So rising real yields need not be a negative factor for financial markets.
However, if yields were rising because of rising inflation fears, the outlook would be very different
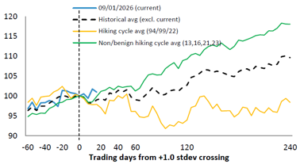
Following a spike in 10 year yields similar to what occurred in September, what do equity markets do?
UBS analysts have examined what US equity markets do in the period subsequent to a spike in 10 year yields of a similar magnitude to what occurred in September (measured in standard deviation terms).
They have found that most important in determining what equities will do from here will be what the Fed does with official interest rates. The most positive outlook for equities would be (unsurprisingly) if the Fed makes no further rate hikes, whereas the most negative equity performance outlook would be associated with further Fed rate hikes.
US S&P 500 performance around 10 year yield spikes
Source: UBS
Volatility in US payrolls makes discerning a trend in the US economy difficult, but it seems to be up
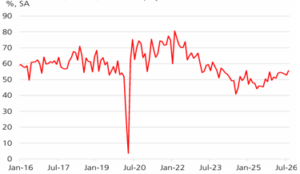
US non-farm payroll reports have been volatile recently, so making judgements about the strength of the US labour market difficult to make – following a four-month period of steadily weakening (but still positive) payroll reports, total nonfarm payroll employment increased by an outsized 162,000 in August.
To try discern a trend in the midst of this monthly volatility, we look at the diffusion index of employment. This index measures the percent of industries with employment increasing employment, plus one-half of the industries with unchanged employment, where 50 percent indicates an equal balance. In a sign that the US economy is broadly strengthening, the index has been trending upward since early 2025 and registered 55.6 in August.
Private employment diffusion Index (1 month)
Source: Bureau of Labor Statistics, Haver UBS
Surveys also suggest that the US economy is strengthening
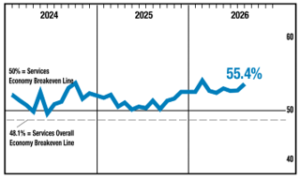
While sharp falls in sentiment surveys are not always a good guide to the subsequent performance of the economy, steadily improving reports tend to be more accurate.
The two key surveys of the US economy are the ISM Manufacturing and the ISM Services surveys. In August the manufacturing survey remained solidly in expansion (at an index level of 54.6) while the Services survey exhibited a continued upward trend – solidly in expansion territory. Together these surveys suggest the US economy is gaining upward momentum.
ISM Services Index
Source: ISM
As near unanimously expected, the RBA raised rates again in September. They may not be finished.
Citing several factors including the materialising of a number of previously identified upside risks to inflation, in a unanimous vote the RBA raised the official cash rate by 0.25% to 4.60% in late September.
Capacity pressures are the key issue here – specifically that growth in demand is outstripping supply capacity – a situation further aggravated by ongoing disruptions to global oil supply and the passing-on of higher oil prices to the prices of other goods and services.
Even though the RBA acknowledged the signs of slowing in the economy, this was not enough to prevent the late September policy tightening with the RBA noting that inflation is still too high. Further hikes could be forthcoming, the RBA warned.
August inflation report suggests that monthly momentum in inflation pressure may have peaked
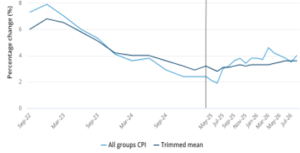
The ABS released the August monthly CPI the day after the RBA rate hike. This report showed that while still high, monthly inflation was not as high as expected, but also that monthly upward inflation momentum may be waning. Suggesting this waning momentum, a number of underlying CPI measures actually recorded zero or negative change over the month:
- Monthly change in the CPI excluding volatile items (e.g.: fruit and vegetables and automotive fuel) was 0%
- Monthly change in non-tradeables items was 0%
- Monthly change in the prices of discretionary items was -0.2% (But monthly change in the prices of non-discretionary items was +0.9%)
All groups CPI and Trimmed mean (annual % change)
Source: ABS
Australian business confidence falls in August
As well as the trend in inflation, the underlying performance of the economy will drive the direction and pace of changes in the official cash rate. It seems clear that the economy is losing momentum.
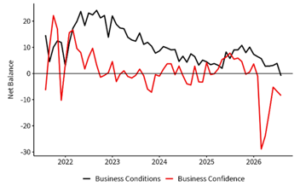
The latest National Australia Bank (NAB) business survey revealed that business confidence fell 2pts in August and remains well below its long-run average. Ongoing global uncertainty, volatility in oil prices and continued cost pressures appear to be weighing on business confidence. Business conditions also declined over the month, falling 5pts and turning negative for the first time in 6 years.
The decline in conditions in the month was broad-based across industries and was driven by a 10pt fall in profitability and a 5pt fall in trading conditions, with both subcomponents now sitting at new post-Covid lows.
Business Confidence and Conditions (Net Balance s.a.)
Source: NAB Monthly Business Survey (August 2026)
Australian consumption spending is also slowing
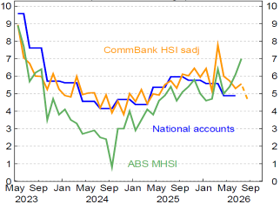
The survey of Household Spending compiled by Commonwealth Bank rose by just 0.1% in August, a sharp slowdown from the 0.6% pace recorded in July. Year ended growth dropped to 4.7% in August, down from 5.2% in July as base effects from a strong second half of 2025 weigh on annual growth.
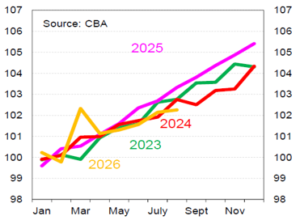
Spending indicators have been choppy in recent months, but CBA suggest that their data is consistent with abroad based slowdown in spending when compared to rates of growth seen in late 2025 and through the first parts of 2026. Slower household income growth together with the ‘wealth effect’ from lower housing prices is expected to put downward pressure on spending.
Of the 12 categories of spending, five recorded gains while five recorded falls in the month.
The strongest gains in August spending were recorded in essential categories: Transport (+2.0%/mth), Insurance (+0.9%/mth) and Health (+0.3%/mth). There were small gains in Hospitality (+0.1%/mth) and Recreation was flat after strong gains in July as households prioritised experiences over the July period.
This pattern is consistent with the inflation data showing that inflation for non-discretionary items is strongest.
CBA Household Spending Indicator (annual % change)
Source: CBA
CBA Household Spending Indicator – comparative year-to-date spending
Source: CBA
Outlook
The global economy has been less negatively impacted by the Middle East war than had been initially feared. But the renewed rise in the oil price, as the Middle East peace has evaporated, is cause for continued caution. But it seems that the trend across most of the globe is one of upside growth surprise
The market outlook in Australia still seems more problematic than many other countries given the RBA’s current policy tightening cycle. It’s difficult to see sentiment about Australian-sourced company earnings and the Australian economy improving until expectations about the RBA’s next policy move switch to expected rate cuts.
However, it might be a mistake to regard the outlook for the local market as being negative over the medium/longer term – the local market’s recent underperformance relative to global markets (in local currency terms) owes much to local monetary policy changes in our view.
We remain slightly underweight Australian Equities, but we are closely monitoring the market for a change in these interest rate policy expectations. The broadening trend of economic weakness could well reduce the RBA’s need to raise rates again and even bring forward prospects for a rate cut. Markets will move well ahead of any actual rate cut and a change in rate expectations could swing sentiment significantly.
Given the magnitude of underperformance of Australian Equities vs Global in local currency terms (especially US) equities, the likelihood of mean reversion is increasing, but we are also cognisant that part of the US outperformance has been driven by superior earnings and not valuation expansion, and that aspect of the US outperformance is therefore justified.

SG Hiscock & Company, trading as SGHiscock Investment Management (SGHiscock) has prepared this article for general information purposes only. It does not contain investment recommendations nor provide investment advice. Neither SGHiscock nor its related entities, directors or officers guarantee the performance of the Funds. SGHiscock also doesn’t guarantee the repayment of capital or income invested in the Funds. Past performance is not necessarily indicative of future performance. Professional investment advice can help you determine your risk tolerance as well as your need to attain a particular return on your investment. We strongly encourage you to obtain detailed professional advice. We recommend that you read the relevant Product Disclosure Statement and Target Market Determination, if appropriate, in full before making an investment decision. SGHiscock publishes information on this platform that is, to the best of its knowledge, current at the time of publication. It is not liable for any direct or indirect losses attributable to omissions, outdated, inaccurate, incomplete or deficient information. Investors and their advisers should make their own enquiries before making investment decisions.
Stay in the loop
Get the latest insights and company news direct to your inbox.