

CIO market update for July 2026
In this CIO market update, Rob Hogg reviews June’s key market drivers. Markets were significantly impacted in June by the near 20% fall in the oil price which declined through most of the month amid a series of progressively more positive developments in the Middle East war. This trend was further assisted by the signing…

In this CIO market update, Rob Hogg reviews June’s key market drivers.
Markets were significantly impacted in June by the near 20% fall in the oil price which declined through most of the month amid a series of progressively more positive developments in the Middle East war. This trend was further assisted by the signing of the US/Iran Memorandum of Understanding on June 17.
The significant fall in oil prices caused investor’s short term inflation expectations to decline sharply, with US inflation expectations (as reflected by the US bond market) over the next two years falling from 2.60% at end May to 1.95% by end June. Emulated in other global markets, this fall in expected inflation drove yields lower in most bond markets over the month. These trends were observable in Australia as well with the yield curve moving lower, in a near parallel fashion, by around 10/12 basis points (0.10%/0.12%).
Equity markets ended mixed over the month – in the US for example, some key indexes recorded gains (Russell 2000 small cap index up 3.6%, Dow Jones up 2.5%) while others recorded falls – Nasdaq down by 2.8% and S&P 500 down 1.1%. The Australian market eked out a small 0.6% return (on an accumulation basis, but in share price-only terms (excluding dividends) has still not advanced from the level reached in October last year when interest rate sentiment began to change.
In currency markets, the US dollar rallied against most currencies (and around 2.5% on a weighted basis (DXY index)). Against the Australian dollar the USD appreciated from AUD/USD 0.7185 at end May to USD 0.6920 by end June. The USD’s strengthening trend gained even greater momentum following the hawkish US central bank meeting around mid-month. Of most significance, the Japanese Yen (JPY) fell to a multi-decade low against the USD during the month.
As noted above, the oil price fell by around 20% in June as investors became more optimistic about a resolution to the Middle East war. Copper (-2.1%) and gold (-12%) prices were also weaker over the month, in part reflecting the appreciation of the USD.
Macroeconomic data released during the month was generally consistent with ongoing strength in both the US and Australian economies (absent the domestic housing market), with official interest rate hikes (or part thereof) priced to occur by year’s end in both countries.
Key market movements over June were as follows:
- S&P/ASX300 Accumulation Index (i.e., including dividends) rose by 0.6%.
- S&P/ASX Small Ordinaries (Australian Small Companies) Accumulation Index fell by 2.0%.
- US equity market (S&P 500) rose by 1.1%.
- Measures of market volatility rose very slightly during the month as measured by the MOVE and VIX indexes which measure expected volatility in bond and equity markets
- The US bond market ended the month with yields lower on longer-dated securities (30-year yield down 0.02% to 4.95%) while shorter-dated yields ended higher (2-year bond yield up 0.17% to 4.17%).
- The Australian bond market behaved differently to the US (but in line with most global markets) with yields drifting around 0.10% lower across the curve. Ten-year yields ended at 4.725%
- Reflecting moves in relative interest rate expectations (lower in Australia and higher in the US), the Australian dollar eased further over the month compared with the USD, closing the month around USD 0.6920, down from USD 0.7185 at end May.
The global economy seems to have weathered the impact of the Middle East war better than most investors had feared. Initial sharp falls in sentiment/confidence surveys of households and corporates have not been followed by similarly weak economic data. And, as economies have proved generally resilient (or at least not as weak as feared), these sentiment surveys have now begun to recover from their lows. With the war seemingly now close to resolution, and the oil price near pre-war levels, it is likely that sentiment and economic activity will recover further.
The key impact of the war has been via its effect on oil prices and inflation expectations:
- The oil price was USD66 (WTI August futures) at the end of February, ahead of the war, and rose to peak at USD100 on May 18 before falling to USD69.50 by end June.
- Shorter term US inflation expectations (US 2-year break-even inflation) rose from 2.70% at end February to a peak of 3.36% on March 18, before falling to 1.98% at end June.
- Australian inflation expectations have followed a similar pattern – at end February inflation expectations over the next 5 years were 2.57% but these rose to a peak of 2.94% on April 30, before retreating to 2.52% by end June.
Although the oil price and inflation expectations have now largely receded, it’s the sharp spike in oil prices over the recent few months and its impact on inflation expectations that was significant enough to contribute to the RBA’s reasoning for their May rate hike:
- ‘The conflict in the Middle East has resulted in sharply higher fuel and related commodity prices, which are already adding to inflation”.
And also the European Central Bank’s June 11 rate increase:
- “The war in the Middle East is generating inflation pressures”.
Perhaps without the war and its impact on oil prices, these rate increases may have been delayed or avoided.
While there remains some near-term geopolitical uncertainty, there is the possibility of a positive market backdrop upfolding with the resolution of the US/Iran war – this could support a ‘Goldilocks’ backdrop where lower energy prices drive market interest rates down (as was the case in June as oil prices retreated further) and, in turn, drive rising growth and earnings optimism.
There are probably myriad risks to this potentially positive outlook, and we discuss one of them in this monthly – the concentration of performance in US equity markets
For Australia the situation is a bit different, mainly because of the preexisting (pre-war) inflation pressures which have likely only been further exacerbated by the war’s short term impact on oil prices. No other developed market economy’s central bank has raised rates as much as the RBA this year and we can see the negative impact of these policy moves in the year to date performance of local equity and bond market returns – we highlight again that the ASX 200 price index (excluding dividends) has failed to move higher since market sentiment about the interest rate outlook began evolving from expecting further rate cuts to expecting hikes on October 17 last year:
- The ASX 200 price index was 8995.3 on October 17, and it has just closed on June 30 at 8778.7.
However, at the point in the future when the local bond market begins to “look-through” any further potential rate hikes and instead begins to focus on potential medium-term rate cuts, much of the current negative sentiment could lift. But until we reach that point, the environment is likely to remain challenging for the Australian economy and its equity market. A key risk here seems to be the impact of the now clear weakening in the Australian housing market – covered later in this monthly.
In this monthly update, we look at:
- The US central bank’s first meeting with new chair Kevin Warsh – more hawkish (ie focussed on fighting inflation, and therefore implicitly higher interest rates and tighter financial conditions) than expected
- US dollar rally boosted by Chair Warsh’s hawkish stance.
- Yen weakened to multi decade lows
- Soft data again leads market participants astray with the US economy remaining resilient
- Significant inflows into US equities continue, margin debt rising
- Reserve Bank keeps rates on hold (as expected) but maintains a hawkish tilt
- Latest Australian Consumer Price Index (CPI) and employment data suggest the RBA may not be finished tightening
- But housing-related sectors of the economy are clearly slowing. Could this “sow the seeds” for a rate cut?
- The outlook
Brand new US central bank Chair Kevin Warsh surprises markets mid-month with a more hawkish stance than expected
At their mid-month meeting, the US central bank under new chair Kevin Warsh, proved to be more “hawkish” than the market expected, removing the monetary policy easing bias and signalling potential for the Fed’s next policy move to be a tightening. Giving the short statement a hawkish tone were the robust factors it noted:
- Economic activity is expanding at a solid pace despite elevated uncertainty [Middle East related],
- Productivity growth and capital investment are strong.
- Job gains have kept pace with the workforce, and the unemployment rate has changed little.
- Inflation remains elevated relative to the Committee’s 2% goal.
The hawkish tone of the statement was cemented with the last sentence that simply stated that “the Committee will deliver price stability”.
This meeting include an update of the so-called “dot-plots” which indicate committee member’s views regarding a range of variables including the expected future policy rate – nine FOMC members of the 19 sitting members signalled the need for a rate hike by year-end. This was an increase from zero in March at the inception of the Iran War.
The tone of the statement caused a sharp upward move in short term (policy-sensitive) bond yields on the day of the announcement, and a fall in equity markets as investors adjusted expectations to allow for a greater risk of higher official rates by year’s end.
US dollar rally boosted by Chair Warsh’s hawkish stance. Yen weakened to multi decade lows
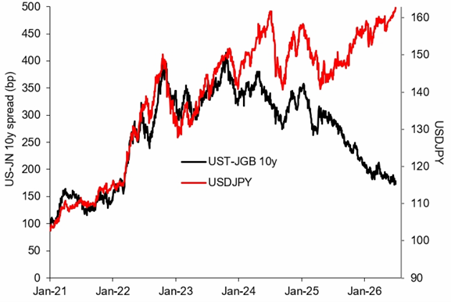
The JPY continued to weaken against the USD in June, at odds with its long-established relationship which has historically been driven by relative US and Japanese bond yields – as Japanese bond yields have moved rapidly higher, converging on US yields in recent months, the Yen would generally have been expected to appreciate against the USD. Instead, the opposite has occurred, and the Yen is at levels (USD/JPY 163) unseen since December 1986.
Even more striking, after taking account of trends in relative inflation rates, (Real Effective Exchange Rate basis) the Yen’s level is closer to where it was trading in the 1960’s according to Macquarie analysts.
US-Japan 10 year bond yield spread versus the USD/JPY
Source: Macquarie, Bloomberg
Macquarie analysts suggest that this apparent relationship breakdown could be another example of “ global speculative excess”. While the cause of this breakdown is open to speculation, the extreme valuation stretch currently being exhibited could be very significant for global portfolio flows when/if it reverses, most likely with negative market consequences.
Has “soft” survey and sentiment data again led us astray?
We have been noting since the Middle East war began that the first type of data to show any impact from the war was, as usual, so-called “soft data” such as consumer and corporate confidence surveys. We have also been warning that there is not always a good relationship between sentiment surveys and actual economic activity – economic activity does not always follow sentiment surveys lower, and often proves resilient, which can then assist the sentiment surveys to recover either after the cause of the negative shock has reversed, or consumers/corporates have become used to the altered environment.
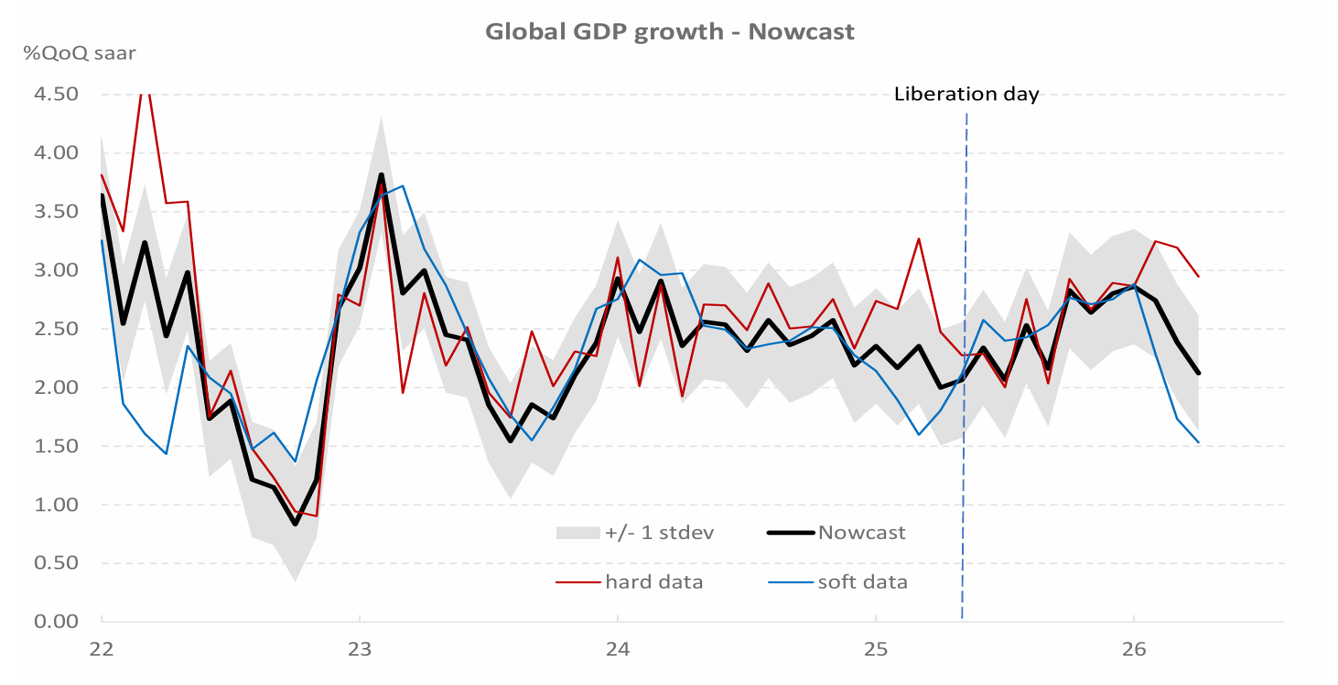
In this current example relating to the impact of the Middle East war, household and corporate surveys quickly reacted negatively to the onset of the conflict in the Gulf, with implied global growth falling by roughly half according to analysts at UBS (from around 3% to 1½%).
But so far there has been very little follow-through from the hard data which has led to the gap between hard and soft data momentum becoming the widest since Liberation Day (April 2, 2025). It seems more likely than not that recent progress in ending the conflict (e.g.: US/Iran MOU) could lead soft data to converge back toward the hard data, rather than hard data converging down toward the surveys.
Widest gap between hard and soft data since “Liberation” Day
Source: UBS
Significant flows into US equities as leverage rises again – exuberance (and market risk) rising?
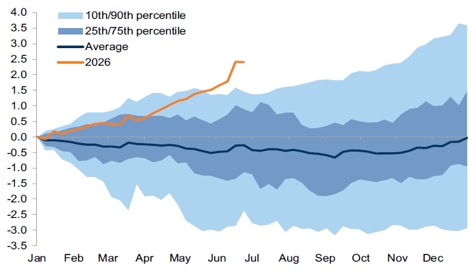
Recent research from Goldman Sachs (GS) highlights one of the current risks to the market outlook – a revival of investor exuberance about US equities, in particular in AI-related companies. This seems to have led to a sharp increase in foreign investor flows into US equity markets.
YTD cumulative global fund flows into US equities (%AUM)
Source: GS “More Signs of levered US exceptionalism positioning” June 29,2026
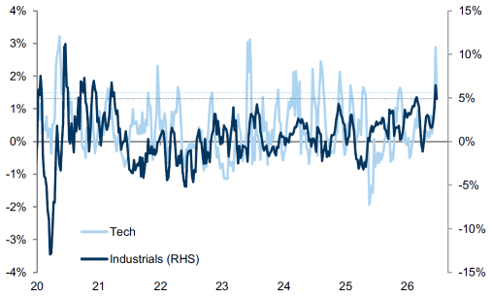
The year-to-date resurgence in foreign flows into US equities has been closely tied to the AI theme, with US Tech fund inflows accelerating to among their strongest levels since 2020, with investors targeting companies involved in AI infrastructure and related capex.
US Tech and Industrial companies – 4 week rolling sector fund flows as % of AUM
Source: GS “More Signs of levered US exceptionalism positioning” June 29,2026
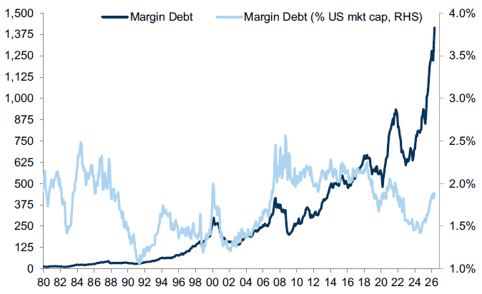
While the pattern of concentrated inflows suggests a significant risk if the Tech sector was to be subject to a deterioration in investor sentiment, another concerning factor is that more and more participation in US markets is funded via rising leverage.
Margin debt – FINRA debit balance in securities margin accounts (USD billion – LHS).
Source: GS “More Signs of levered US exceptionalism positioning” June 29,2026
This accelerating exuberance and rising margin debt likely remains the key endogenous risk to global markets – in this context, an endogenous risk is one generated from within the financial system.
Reserve Bank keeps rates on hold (as expected) but maintains a hawkish tilt
The RBA’s June meeting was the first meeting this year at which the RBA did not tighten monetary policy – meetings in February, March and May had each resulted in rate hikes. But while the RBA kept rates on hold at 4.35%, it’s bias clearly remains toward tightening as revealed by the inclusion of the following wording in the latest RBA policy decision:
- “Inflation is still too high”,
- “To deliver price stability and full employment [the RBA] will do what it considers necessary to achieve that outcome, including increasing the cash rate target further if required”.
The RBA did note some factors that could pave the way for a change in their policy bias (toward easing) – “consumer spending is slowing as expected” and “momentum in the housing market has shifted, with housing prices falling in some capital cities“.
Key to a future potential change in policy bias is that the RBA is able to see slowing inflation momentum which, according to the latest monthly data, is still not occurring.
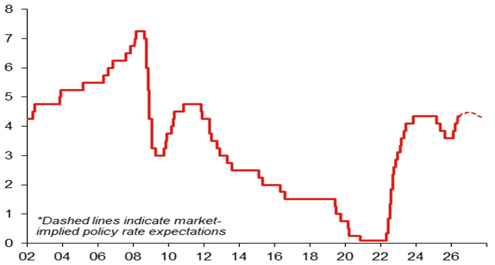
As at the end of June, market-implied expectations for the RBA policy rate at the RBA’s December 8 meeting are priced for a fraction of one full rate hike (+11 basis points), a halving from the implied increase of 22 basis points priced as at end May.
Market expectations of future RBA policy rate (%)
Source: Bloomberg, Macquarie
Latest Australian Consumer Price Index (CPI) and employment data suggest the RBA may not be finished tightening
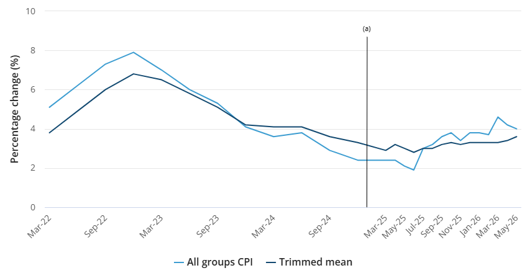
The latest (May) monthly CPI report revealed that underlying inflation pressures remain robust. In particular, the annual change in the Trimmed Mean inflation measure accelerated to 3.6%, up from 3.4% in April 2026.
This measure is the RBA’s key barometer of inflation as it excludes a number of more volatile aspects of the ABS’s overall basket – specifically the items that rise and fall by the most over any defined time period. The main factors driving this measure higher include housing-related inflation (at 6.5% over the 12 months to May) reflecting rising costs for electricity, new dwellings and rents.
All groups CPI and Trimmed mean, Australia, annual change (%)
Source: ABS
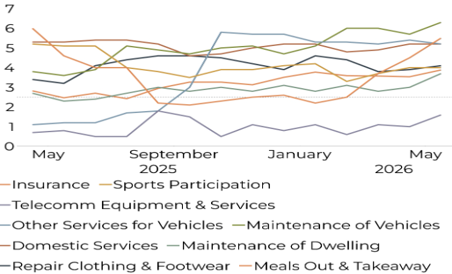
Inflation in the market services sector also remains a key upward influence on Australia’s inflation rate. Changes in wage rates are a key driver of this type of inflation which, following the recent National Wage Case, are likely to continue making a solid contribution to inflation.
Inflation in the market services segment of the CPI
Source: ABS, Barrenjoey
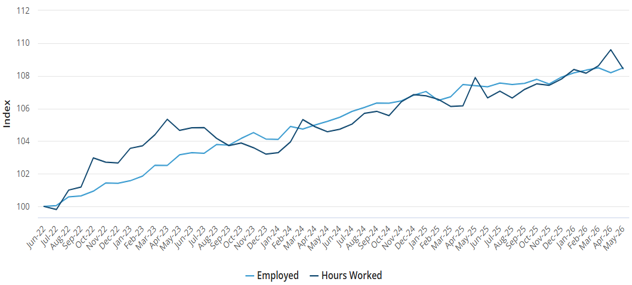
After recording a fall of 18,600 in total employment and a jump to a 4.5% unemployment rate in April, the May employment report was stronger than expected revealing an increase of 40,300 in employment and a partial retracement of the unemployment rate to 4.4%.
After taking account of the volatility in monthly outcomes, its seems that growth in the number of people employed is slowing at a gradual pace with trend employment growth now at 0.1% per month and the unemployment rate drifting only very slowly higher. The labour force is still described by the RBA in their latest statement as resilient:
- “The unemployment rate was higher than expected in April, but other measures of labour market conditions have been more resilient”.
Employment and hours worked
Source: ABS
While there remains upward momentum in inflation and employment, housing-related sectors of the economy are clearly slowing. This could “sow the seeds” for a rate cut
With the RBA’s three rate hikes this year perhaps already beginning to negatively impact the housing sector, it seems that the budget measures regarding capital gains and negative gearing across asset classes, including housing, may have added to the developing negative momentum in the housing sector. This negative momentum can have significant “multiplier” effects across the rest of the economy.
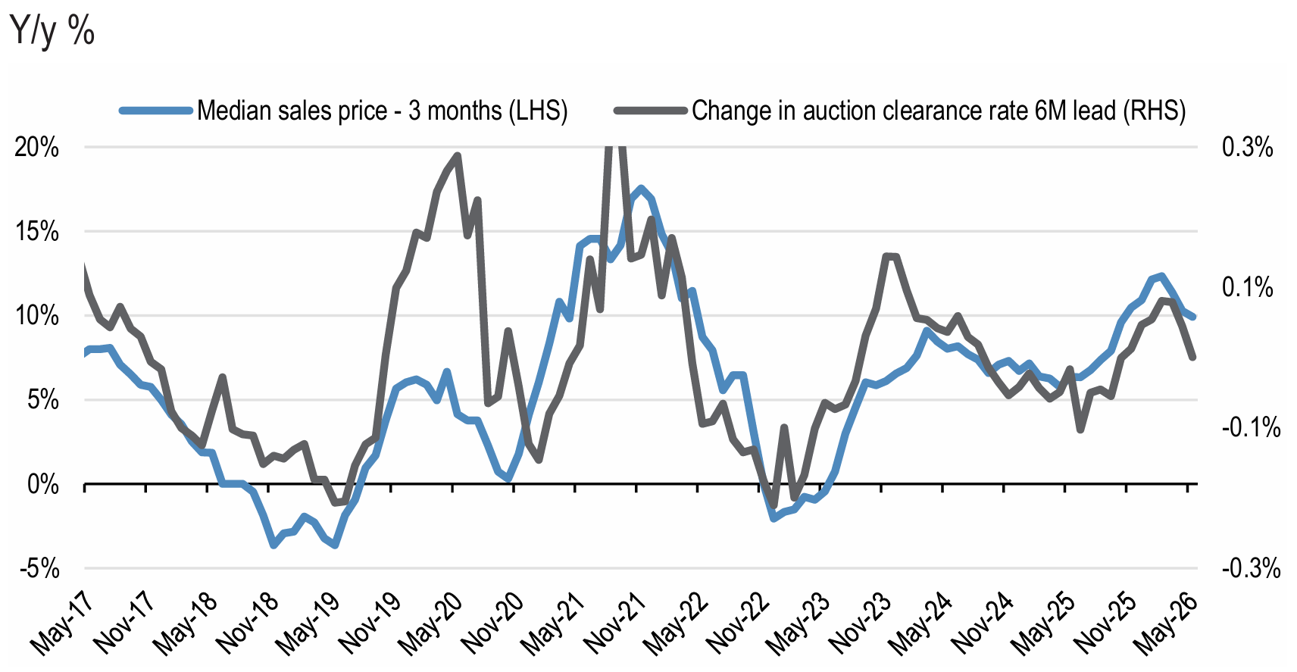
A key indicator of the deteriorating health of the housing sector is the fall in nationwide auction clearance rates (to be fair, a more important measure in some capital cities than others). Unsurprisingly there is a clear relationship between auction clearance rates and prices as can be seen below:
Auction Clearance Rates and House Prices
Source: Cotality, JP Morgan
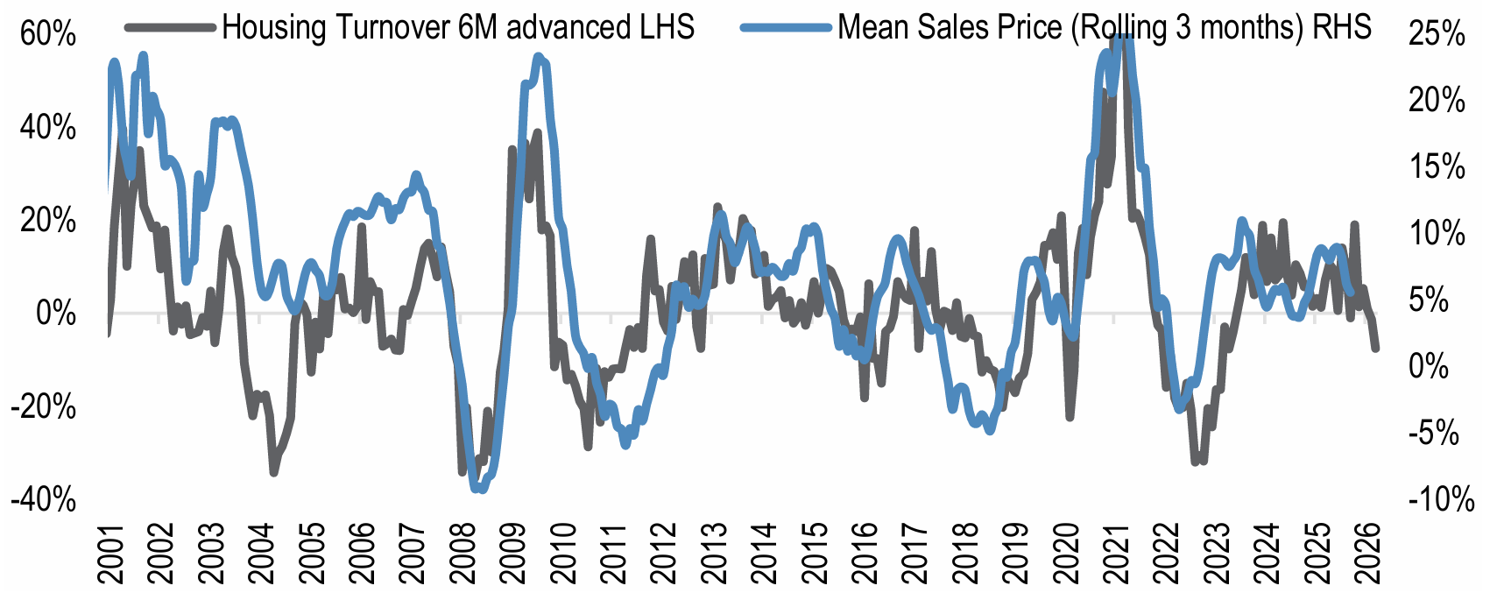
Housing turnover also weakens as house prices fall, and this probably has a bigger negative “multiplier” effect on the economy with fewer sales and turnover leading to less spending on housing-related products and services (furniture/household equipment/household services) across the rest of the economy.
Dwelling sales turnover and prices
Source: Cotality, JP Morgan
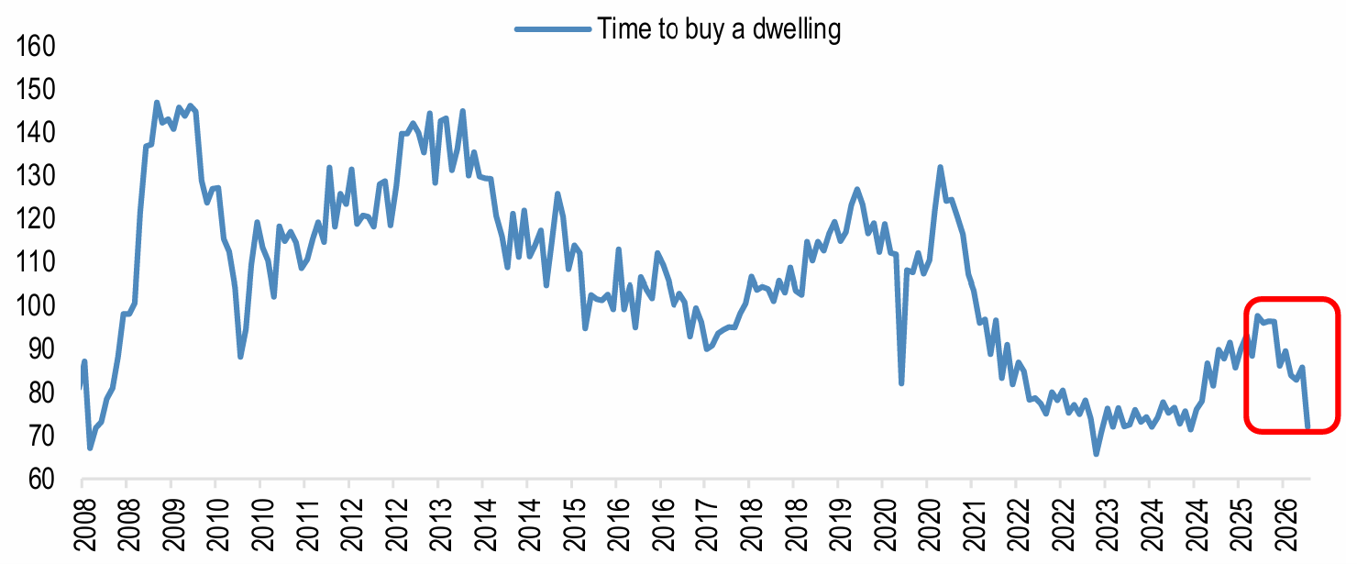
Understandably, the weakening in the housing market has had an immediate impact on house purchase intentions with the Westpac/Melbourne Institute’s “Time to Buy a Dwelling” index falling 16.1% to 72 in May, an 18-month low, and nearly 50 points below the long run average of 119. (Perhaps it will be some time before lower prices entice greater buying?)
Time to Buy a Dwelling
Source: Westpac-Melbourne institute
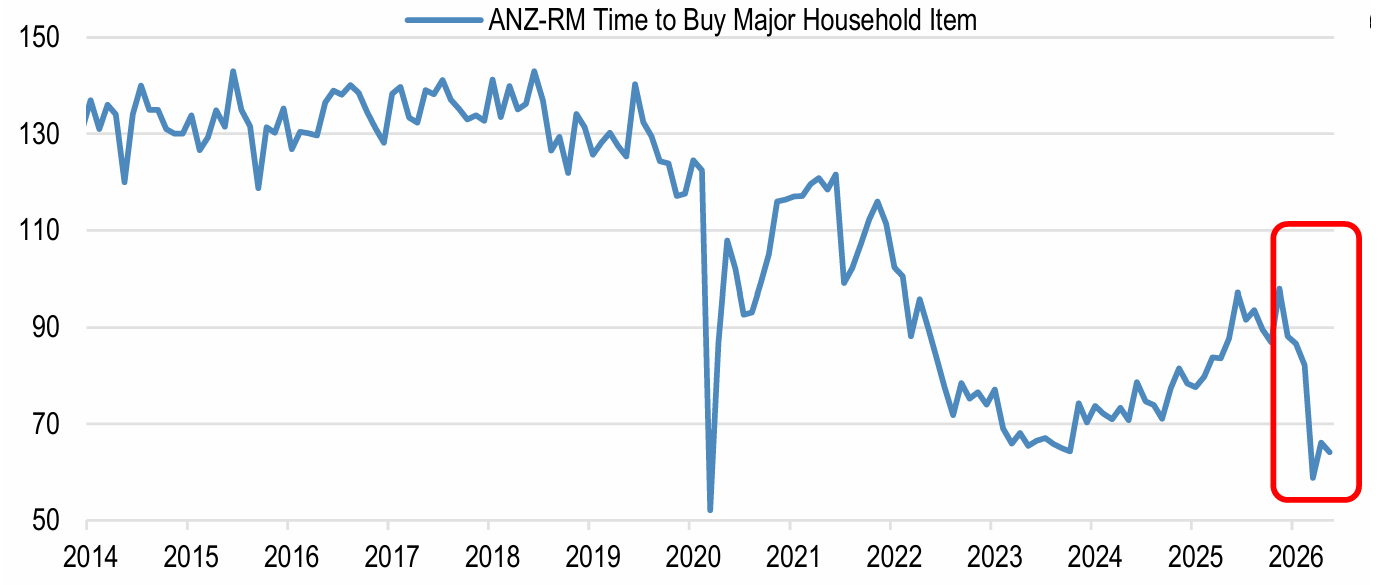
Pointing to the “multiplier” effect of the weakening housing market, household’s intentions to purchase a major household item have also fallen sharply in recent months.
Time to Buy a Major Household Item
Source: ANZ-RM
Australian equity market performance in June – modest gain belies underlying variability in sector returns. June quarter relative sector returns were near the opposite of the prior quarter.
The ASX 300 Accumulation Index returned just 0.6% for the month of June, and 6.2% for the full financial year. The Small Ordinaries Accumulation Index fell 2% in June but returned 8.1% over the full year.
Better performing sectors in the month of June included Health Care (13.3%), Consumer Staples (13.0% and Consumer Discretionary (12.2%). Poorest performing sectors included Energy (-8.9%) and Materials (-6.7%)
Sector performances over the June quarter showed a reversal of trends in the March quarter with poorly performing sectors in the March quarter such as Consumer Discretionary, Information Technology and Real Estate posting double-digit gains in the June quarter. Better performing sectors in the March quarter including Energy and Utilities underperformed in the June quarter while Health Care’s poor performance continued.
• OUTLOOK •
The global economy seems to have been less negatively impacted by the Middle East war than had been initially feared. With the oil price now having receded, and inflation expectations back at pre-war levels, the outlook seems broadly positive. Perhaps the biggest risk to this outlook is the current exuberance again being exhibited by investors in US markets.
However, the market outlook in Australia seems more problematic given the RBA’s current policy tightening cycle. It’s difficult to see sentiment about Australian shares and the Australian economy improving until expectations about the RBA’s next policy move switch to expected rate cuts.
However, it might be a mistake to regard the outlook for the local market as being negative over the medium/longer term – the local market’s significant recent underperformance relative to global markets owes much to local monetary policy changes in our view.
We remain slightly underweight Australian Equities, but we are closely monitoring the market for a change in these interest rate policy expectations, and this could occur soon (especially if the housing market weakness continues). A change in rate expectations could swing sentiment significantly.
Given the magnitude of underperformance of Australian Equities vs Global (especially US) equities, the likelihood of mean reversion is increasing, but we are also cognizant that part of the US outperformance has been driven by superior earnings and not valuation expansion, and that aspect of the US outperformance is therefore justified.
Read all CIO market updates | Follow us on LinkedIn | Back to the top ⏫
Disclaimer:
SG Hiscock & Company (SGH) has prepared this article for general information purposes only. It does not contain investment recommendations nor provide investment advice. Neither SGH nor its related entities, directors or officers guarantee the performance of the Funds. SGH also doesn’t guarantee the repayment of capital or income invested in the Funds. Past performance is not necessarily indicative of future performance. Professional investment advice can help you determine your risk tolerance as well as your need to attain a particular return on your investment. We strongly encourage you to obtain detailed professional advice. We recommend that you read the relevant Product Disclosure Statement and Target Market Determination, if appropriate, in full before making an investment decision.
SGH publishes information on this platform that is, to the best of its knowledge, current at the time of publication. It is not liable for any direct or indirect losses attributable to omissions, outdated, inaccurate, incomplete or deficient information. Investors and their advisers should make their own enquiries before making investment decisions.

SG Hiscock & Company, trading as SGHiscock Investment Management (SGHiscock) has prepared this article for general information purposes only. It does not contain investment recommendations nor provide investment advice. Neither SGHiscock nor its related entities, directors or officers guarantee the performance of the Funds. SGHiscock also doesn’t guarantee the repayment of capital or income invested in the Funds. Past performance is not necessarily indicative of future performance. Professional investment advice can help you determine your risk tolerance as well as your need to attain a particular return on your investment. We strongly encourage you to obtain detailed professional advice. We recommend that you read the relevant Product Disclosure Statement and Target Market Determination, if appropriate, in full before making an investment decision. SGHiscock publishes information on this platform that is, to the best of its knowledge, current at the time of publication. It is not liable for any direct or indirect losses attributable to omissions, outdated, inaccurate, incomplete or deficient information. Investors and their advisers should make their own enquiries before making investment decisions.
Stay in the loop
Get the latest insights and company news direct to your inbox.