
Informed Momentum – the factors’ factor?
The momentum premium is the empirical observation that equities which have outperformed in the recent past continue to outperform for a period of time. The seminal research paper on momentum as a factor was authored by two academic scholars, Narasimhan Jegadeesh and Sheridan Titman (1993) who demonstrated that the strategy of buying stocks that have done well and shorting stocks that have done poorly generated significant positive returns over 3- to 12-month holding periods. Since then, numerous academic scholars have found momentum’s strength to be significant, persistent, and pervasive across asset classes. For these reasons, Fama and French (2008) declared momentum as “the premier market anomaly”.
Building on this factor, San Diego based investment firm EAM Investors has developed a systematic investment process, Informed Momentum®, which has been designed to build upon the momentum premium to deliver alpha for clients. This approach combines momentum with stock selection, tailored risk management, and efficient implementation to deliver more consistent and predictable return streams.
Diversified portfolio construction requires a number of considerations – so how can momentum play its part in helping drive investor returns?
Momentum – where does it all fit?
The Style Box (1), introduced by Morningstar in 1992, consists of a three-by-three grid, aiming to deliver a framework that would ultimately improve multi-portfolio construction. To do this, it represents an easily interpreted visual of underlying portfolio characteristics. Size and style, represented by market capitalization and valuation, were the basis for the grid with a portfolio’s weighted-average market capitalization determining its classification as large, mid, or small. Conversely, two representative valuation frameworks determine a portfolio’s style as value, growth, or somewhere in between – otherwise known as blend (core). The premise of the Style Box was simple – complementary boxes can be combined in any fashion to improve investment outcomes at an expected level of risk – and the potential for a properly diversified portfolio of portfolios is realized. However, to capitalise on this potential, there is substantial room for improvement. If the goal is to improve outcomes at the total fund level, then the introduction of another style cannot be ignored. This is where momentum enters the picture.
The foundation for the traditional Style Box framework is the Fama-French five-factor model (FF-5). This widely popular factor model proposes to explain stock returns according to market, size, value/growth, operating profitability, and investment factors. Evidence for the inclusion of an additional style in the common Style Box framework can be demonstrated by looking at the ability of FF-5 to explain various stock pricing anomalies.
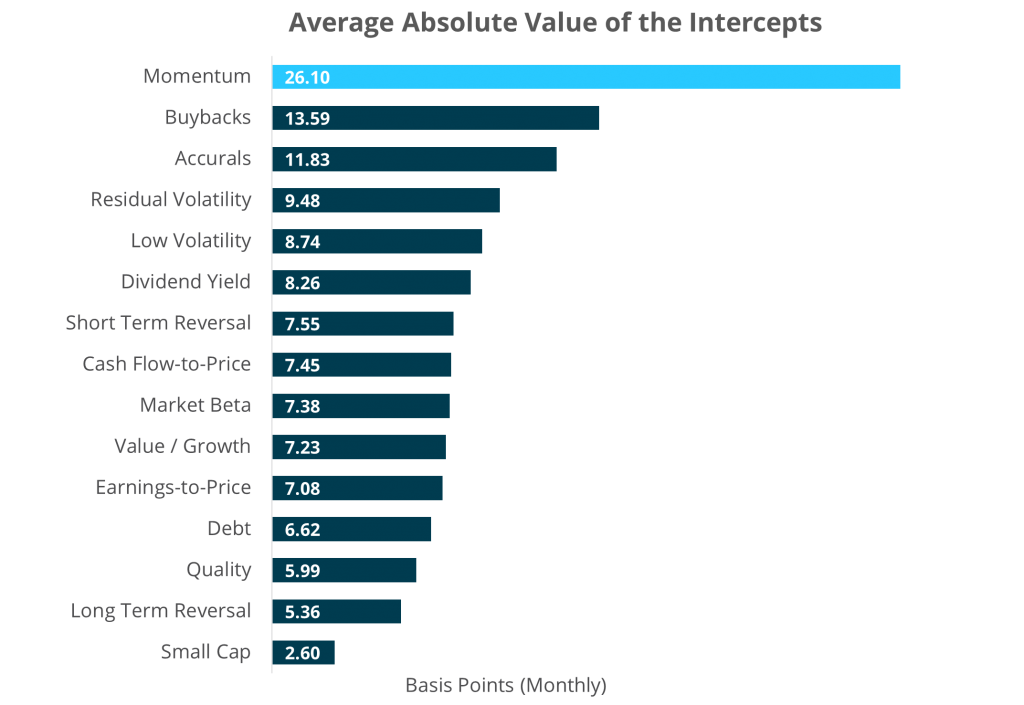
To test the ability of the FF-5 and the Style Box framework to explain stock returns, the EAM team considered a US equity universe of stocks and tested fifteen sets of top decile portfolio returns arising from famous stock pricing anomalies. For each anomaly, EAM separately regressed each of the top decile returns (in excess of the risk-free rate) onto the FF-5 and then computed the average over the absolute value of the intercepts.
These measures represent the error involved in the FF-5’s ability to explain each anomaly. Figure 1 displays the average absolute pricing errors. Notice that momentum gives the FF-5 model the greatest challenge with 26 basis points per month of error. This large error means that if an investor only uses the FF-5 as a basis for their investments, they lose out on the additional 26 basis points per month that momentum provides above the FF-5 factor returns.
Figure 1: Pricing Errors for Stock Pricing Anomalies: July 1963 – December 2022
Source: Ken French’s website: https://mba.tuck.dartmouth.edu/pages/faculty/ken.french/data_library.html
Momentum as an alpha source.
Using data from Fama-French’s library, the EAM team constructed US long-only, market cap-weighted, top quintile portfolios for momentum, value, and growth. Momentum is based on the top trailing 1-year return excluding the most recent month, while the value is based on top book-to-market ratios, and growth is based on the bottom book-to-market ratios. The market portfolio is a market-cap weighted representation of all stocks in the full corresponding equity universe.
This analysis was performed with all available data for US equities (January 1927 – December 2022) and for Non-US equities (November 1990 – December 2022).
Table 1 and 2 provide several measures of performance and risk statistics associated with momentum, value, growth, and the market in both US and Non-US equity universes. In terms of single-factor alpha satellites, momentum is shown to be the leader by far, outperforming value, growth, and the market over time on both an absolute and risk-adjusted basis. Alone, this dynamic is a good reason for the inclusion of momentum in a portfolio. Interestingly, the growth strategy trails the market portfolio in each case, providing a basis to question growth’s inclusion in an investor’s portfolio.
Table 1: Strategy Statistics (US equities) – January 1927 – December 2022
| Momentum | Value | Growth | Market | |
| Return (Annualized) | 14.86% | 12.98% | 9.55% | 9.87% |
| Volatility (Annualized) | 20.25% | 27.83% | 18.90% | 18.55% |
| Tracking Error (to Market) | 8.47% | 14.38% | 4.72% | — |
| Sharpe Ratio | 0.57 | 0.35 | 0.33 | 0.36 |
| Information Ratio (to Market) | 0.59 | 0.22 | -0.07 | — |
| T-Stat (Excess Returns) | 5.61 | 3.23 | -0.44 | — |
| Batting Average (Excess Returns) | 60% | 52% | 50% | — |
Table 2: Strategy Statistics (non-US equities) – November 1990 – December 2022
| Momentum | Value | Growth | Market | |
| Return (Annualized) | 8.99% | >7.71% | 4.47% | 6.28% |
| Volatility (Annualized) | 16.82% | 19.00% | 16.78% | 16.46% |
| Tracking Error (to Market) | 6.62% | 6.13% | 4.72% | >– |
| Sharpe Ratio | 0.39 | 0.28 | 0.12 | 0.24 |
| Information Ratio (to Market) | 0.41 | 0.23 | -0.38 | — |
| T-Stat (Excess Returns) | 2.23 | 1.68 | -2.01 | — |
| Batting Average (Excess Returns) | 59% | 54% | 46% | — |
Source: Portfolios are calculated using data from Ken French’s website: https://mba.tuck.dartmouth.edu/pages/faculty/ken.french/data_library.html. The Market portfolio return represents the cap-weighted entire universe of stocks returns. Please see Important Disclosures at the end of this document.
In the traditional style box setting, investors typically choose portfolio combinations related to market capitalization (size) and value/growth strategies. The idea being that, partitioning the market in this way, one can diversify one’s holdings while gaining exposure to all areas of the market. Intuitively, this makes sense if each partitioning strategy, independently, displays a premium above and beyond the market return. However, for the typical growth strategy, as demonstrated above, this is simply not the case. Gaining exposure to premia that pay in a diversified manner is a more robust strategy compared to the traditional style box setting.
Informed Momentum® – taking momentum that step further.
Harnessing the momentum premium requires specialized skill. Informed Momentum® combines momentum with stock selection, tailored risk management, and efficient implementation to deliver alpha for clients. This time-tested approach was developed by EAM Investors and has been applied consistently across all its strategies since inception in 2007. The foundation for Informed Momentum® is rooted in three central tenets:

Momentum in Global Small Caps
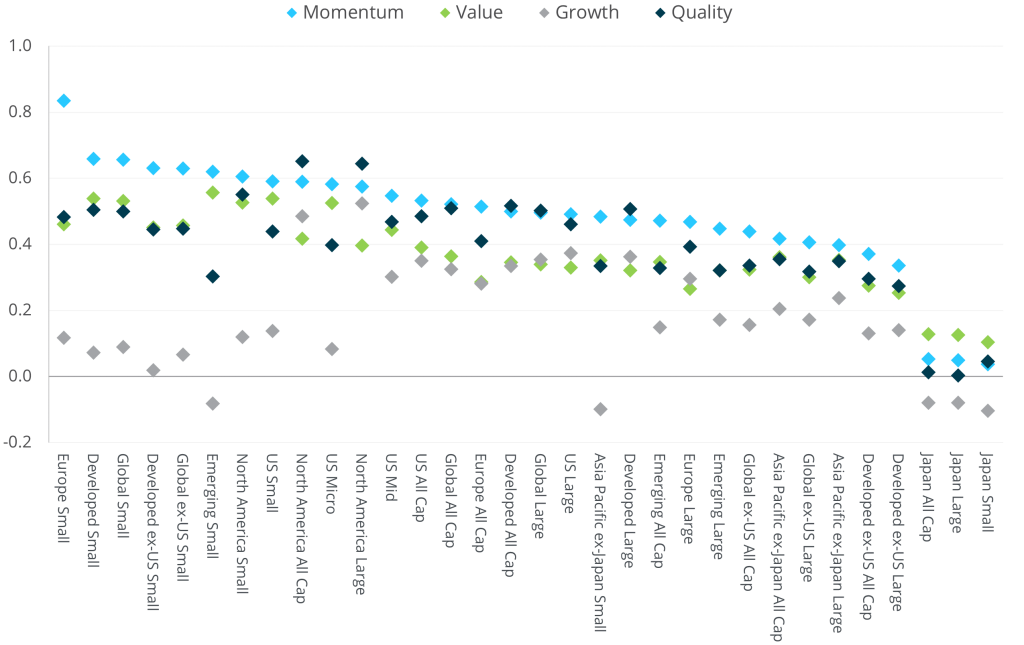
EAM further analysed momentum and other factors in 32 distinct global equity markets, varying by geography and market capitalizations. This analysis showed momentum to work particularly well in global small cap equity markets.
In all markets, momentum demonstrated exceptional performance, surpassing the respective market return. Furthermore, momentum consistently yielded the highest excess returns, outperforming other factors in 91% of the samples. Momentum also exhibited superior risk-adjusted returns (Sharpe ratio) in 75% of the samples, emphasizing its ability to generate favourable returns with lower associated risk.
For the charts below we used aggregated data from July 1963 for US Equities, July 1991 for Global/Non-US Equities through August 2023.
Figure 2: Excess Return to Market

Figure 3: Sharpe Ratio
Source: EAM analysis.
By incorporating momentum within a small cap universe, investors can potentially unlock a more reliable and persistent source of alpha. These findings underscore the importance of continuously adapting investment strategies to evolving market conditions as well as highlight the continued relevance of momentum as a robust factor. As the investment landscape continues to evolve, leveraging momentum strategies may prove instrumental in navigating the shifting tides of financial markets and achieving sustained outperformance.
References:
[1] Fama and French (1992) also contributed to the proliferation of the use of the Style Box in “The Cross-Section of Expected Stock Returns”, The Journal of Finance, 47, 427-465. Pg. 451: “Our main result is that two easily measured variables, size, and book-to-market equity seem to describe the cross-section of average stock returns.”
Asness, Cliff S. and Frazzini, Andrea and Israel, Ronen and Moskowitz, Tobias J. and Moskowitz, Tobias J., “Fact, Fiction and Momentum Investing”. Journal of Portfolio Management, (2014).
Fama, Eugene F., and Kenneth R. French, “The Cross-Section of Expected Stock Returns.” The Journal of Finance, 47, 427-465. (1992).
Fama, Eugene F., and Kenneth R. French, “A five-factor asset pricing model.” Journal of Financial Economics, Volume 116, Issue 1, (2015).
Gibbons, Michael R., Stephen A. Ross, and Jay Shanken. “A Test of the Efficiency of a Given Portfolio.” Econometrica 57, no. 5 (1989).
Fama, E.F. and French, K.R. (2008), Dissecting Anomalies. The Journal of Finance, 63, 1653-1678.
Fama-French returns referenced in this document are calculated using monthly and daily data from Ken French’s website: https://mba.tuck.dartmouth.edu/pages/faculty/ken.french/data_library.html
Narasimhan, Jegadeesh and Sheridan, Titman (1993), Returns to Buying Winners and Selling Losers: Implications for Stock Market Efficiency. Journal of Finance, 48(1), 65-91.
Prentice, Travis, Wroblewski, David. EAM Insights: Momentum works everywhere, 2023. (link)
Prentice, Travis, Wroblewski, David. EAM Insights: Challenging the Traditional Style Box with Momentum, 2023. (link)
The U.S. Dollar is the currency used to express performahttp://tinyurl.com/42ncdmrtnce.
For more information how you can benefit from the EAM’s Informed Momentum® approach, visit the EAM Global Small Companies Fund page.
Disclaimer:
SG Hiscock & Company and EAM investors has prepared this article. The information provided here is for general informational purposes only and should not be considered an individualized recommendation or personalized investment advice. The investment strategies mentioned here may not be suitable for everyone. Each investor needs to review an investment strategy for his or her own particular situation before making any investment decision. All expressions of opinion are subject to change without notice in reaction to shifting market conditions. Data contained herein from third-party providers is obtained from what are considered reliable sources. However, its accuracy, completeness or reliability cannot be guaranteed. Supporting documentation for any claims or statistical information is available upon request. Investing involves risk including loss of principal. Past performance is no guarantee of future results and the opinions presented cannot be viewed as an indicator of future performance.
We strongly encourage you to obtain detailed professional advice and to read the relevant Product Disclosure Statement and Target Market Determination, if appropriate, in full before making an investment decision. They can be downloaded here.
SG Hiscock & Company publishes information on this platform that to the best of its knowledge is current at the time and is not liable for any direct or indirect losses attributable to omissions for the website, information being out of date, inaccurate, incomplete or deficient in any other way. Investors and their advisers should make their own enquiries before making investment decisions.
EAM Global Small Companies Fund (APIR ETL1755AU) is made available to Australian investors through a partnership between the investment manager SGH Hiscock & Company (Australia) and the fund manager EAM Global Investors (US).
Equity Trustees Limited (“Equity Trustees”) (ABN 46 004 031 298), AFSL 240975, is the Responsible Entity for the EAM Global Small Companies Fund (“the Fund”). Equity Trustees is a subsidiary of EQT Holdings Limited (ABN 22 607 797 615), a publicly listed company on the Australian Securities Exchange (ASX: EQT).
Equity Trustees nor any of its related parties, their employees or directors, provide and warranty of accuracy or reliability in relation to such information or accepts any liability to any person who relies on it.
